📢 Sign up to my newsletter and never miss a beat!
In this article, we are going to have a look at how to quickly and easily estimate the market size of your software product for free, while at the same time aiming to stay as accurate as possible.
Market sizing is the process of estimating the potential revenue for a product or service within a given market and is normally communicated in terms of annual revenue. It is an important exercise for all businesses to carry out regularly, particularly useful for startups and entrepreneurs in the early stages of their business. Market sizing helps businesses understand the people they’re serving in order to provide the products and services that address their needs. It tells you whether a market is big enough to be worth investing in and indicates whether your product or service will be viable. Market size data is useful when seeking financing, as it gives investors an idea of the market potential for profit and scaling. Market sizing research indicates which products or services you should offer more of and which you should offer less of. It also tells you whether the market is growing and moving in the right direction for your organization’s goals. Calculating market size requires you to make various assumptions regarding your sector, industry, and product or service. This means that it is not an exact science, and assumptions must be continually refined and reviewed as you gather more data about your market. With that being said, in our work as product managers we all need to do a market sizing exercise once in a while to assess the current situation and adjust our strategic plans. Sometimes we need to get the numbers as quickly as possible, without spending days and weeks into thorough market research, just to have a general idea of a particular market and its approximate size, simply because we have to make quick decisions and/or to present facts and numbers about our industry to the other stakeholders.
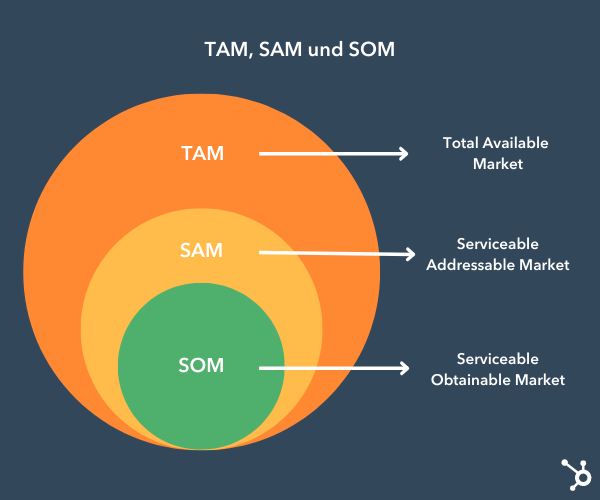
When speaking of market sizing there are three key metrics and three main levels of granularity you have to bear in mind and you`ll hear people talk about. These are:
Total Addressable Market (TAM): TAM is the total market demand for a product or service. It’s the maximum amount of revenue a business can generate by selling its product or service in a specific market. The total addressable market is most useful for businesses to objectively estimate a specific market’s potential for growth. This data also helps companies figure out product market fit.
Serviceable Addressable Market (SAM): Due to the limitations of your business model (such as specialization or geographic limitations), you’ll have a tough time servicing your total addressable market. Serviceable addressable market is most useful for businesses to objectively estimate the part of the market they can acquire to figure out their targets.
Serviceable Obtainable Market (SOM): Unless you’re a monopoly, you most likely can’t capture 100% of your serviceable addressable market. Even if you only have one competitor, it would still be extremely difficult to convince an entire market to buy your product or service. SOM is the portion of the SAM that you can realistically capture.
What are the main methods to estimate the market size?
Businesses employ various methodologies to estimate the potential revenue and size of their target markets. Nevertheless, the two primary approaches that dominate this landscape are the top-down approach and the bottom-up approach.
1. Top-Down Approach
The top-down methodology takes a panoramic view, starting with the overall market and gradually narrowing down to estimate the potential revenue for a specific product or service. This approach often leverages existing industry reports, market research studies, and macroeconomic data to derive an overarching perspective. By applying percentages or ratios to segments of the broader market, businesses can estimate their potential share. While the top-down approach provides a quick and high-level estimation, its reliance on generalized data can sometimes lead to oversimplification and may not capture the nuances of specific market segments.
2. Bottom-Up Approach
In contrast, the bottom-up approach takes a granular and more detailed route. It begins by estimating the demand at the individual customer or transaction level and then aggregates these figures to determine the overall market size. This methodology often involves conducting primary research, such as surveys, interviews, or studying historical sales data. The bottom-up approach is considered more accurate for niche markets or products with distinct customer segments, as it allows for a more precise understanding of customer behaviors and preferences. However, it can be resource-intensive and time-consuming due to its meticulous data gathering requirements.
Choosing the Right Methodology:
The choice between top-down and bottom-up methodologies depends on factors such as the available data, the nature of the market, and the level of precision required. For broad market assessments or when time is of the essence, the top-down approach provides a quick estimate. On the other hand, for products with diverse customer bases or in markets with complex dynamics, the bottom-up approach is favored for its depth and accuracy.
Hybrid Approaches:
In practice, businesses often adopt hybrid approaches that combine elements of both top-down and bottom-up methodologies. This blending allows for a more comprehensive understanding, leveraging the strengths of each approach. For instance, a business might use top-down estimates for a broad market overview and then refine the figures using bottom-up analysis for specific segments.
Iterative and Dynamic:
Regardless of the chosen methodology, market sizing is an iterative and dynamic process. It requires constant refinement as new data becomes available, market conditions evolve, and the business landscape shifts. Successful market sizing involves not only selecting the right approach but also a continuous commitment to updating and improving estimates to ensure they accurately reflect the ever-changing market realities.
What are the main steps of the market sizing process?
The market sizing proccess takes systematic approach to estimate the potential revenue, demand and size of a target market. In case you`re unsure how to go about it, below is a general guide that can help you clarify this for yourself . Later in this article, I`m going to give you an example of an estimation model using the top-down approach that can also show you how to navigate through the process.
1. Define Your Objective
Clearly articulate the purpose of your market sizing effort. Are you estimating the market size for a new product launch, assessing investment opportunities, or optimizing resource allocation? Defining your objective sets the context for the entire process.
2. Clarify the Scope:
Define the boundaries of your target market. Consider factors such as geographic regions, demographics, industry sectors, and specific customer segments. Clarifying the scope ensures that your analysis is focused and relevant to your business goals.
3. Choose your approach
Select the market sizing methodology that aligns with your objective and available resources. Decide whether a top-down, bottom-up, or hybrid approach is most appropriate. Each approach has its strengths and is suited to different types of markets and business scenarios. If you need to do a quick assessment of the market size, use the top-down approach.
4. Choose assumptions
Identify the key variables and assumptions that underpin your market sizing analysis. These will be the individual factors whose values will be part of your estimation formula. They may relate to market growth rates, the number of the population within a given group segment, customer behaviors, or competitive dynamics. Being explicit about your assumptions promotes transparency and helps stakeholders understand the basis of your calculations.
5. Gather Data and attach values to your assumptions
Collect both primary and secondary data relevant to your target market. Primary data may involve surveys, interviews, or direct customer feedback. Secondary data can be sourced from industry reports, market research studies, government publications, and reputable online databases. Ensure the data is recent and reliable. The top-down approach we discuss in this article, focuses more on a secondary data, such as official government census statistics, existing studies and reports. Once you got the necessary data that’s relevant to your case, this will allow you to attach values to your assumptions.
6. Calculate
Based on your chosen approach and the gathered data, begin the calculations. For a top-down approach, start with the overall market size and apply percentages to estimate your potential market share. In a bottom-up approach, aggregate data from individual customer segments to derive the overall market size.
7. Do a reality-check
Validate your calculations by cross-referencing data from different sources and assessing the consistency of your results. This reality-check ensures the reliability and robustness of your market sizing.
Free souces of data
If you wonder where you can get free data and statistics to calculate your market size and back up your assumptions, I prepared a list of the most common (and some less popular) and data-rich sources for you that I hope will help you. Since this article is about how to calculate a market size quickly and for free, I focused on sources where you can get some value out of charge, without needing to pay.
For US
- United States Census Bureau – for demographic information of all kinds.
- US Bureau of Labor Statistics – for all kinds of labor-related and job-specific information.
- Scalepath.io – a subscription-based solution, mainly aimed at B2B businesses, that leverages massive public data (for now US only) and allows you to automate your market size calculations. You can pre-select any variable from their list of options (which is huge) you want to factor in in your formula and you`ll get the market size estimated for you. There is a 7-day free trial during which you can take advantage of their database (no, they do not restrict their data for free trial users, at least for now) and automation capabilities. This is more than enough to do your work or if you want to reality-check your own estimations or assumptions with one more source. However, as with any other automated solution, remember to use your own judgment and do not rely 100% on it or that it will do the entire work for it. Personally, I would use it as a complementary tool that assists and faciliatates my work.
For Canada:
- Statistics Canada
Statistics Canada is the national statistical office. It contains key information on Canada’s economy, society and environment. Their data covers wide range of topics: from demographics and geographic to digital, business and consumer information. - Canadian Economic Dashboard and COVID-19
This is a web application that provides access to key indicators on the impact of COVID-19 on the Canadian economy. You can explore data on GDP, employment, inflation, trade, retail sales and more. - Canadian Industry Statistics This is a website that provides data and analysis on the performance of Canada’s industries. You can find data on revenues, expenses, profits, employment, productivity, innovation and more for various sectors and subsectors of the economy.
For the UK:
Office for National Statistics
This is the official website of the UK’s national statistical agency. It publishes statistics and reports on different aspects of the UK’s population and economy. Topics cover:
- Business, industry, and Trade:
– Key information on businesses broken by activity, size (turnover, employees), and location
– Construction industry
– IT and internet industry (internet users, key ecommmerce sales information)
– International Trade
– Manufacturing and production industry (UK manufacturing and other production industries (such as mining and quarrying, energy supply, water supply and waste management), including total UK production output, and UK manufactures’ sales by product and industrial division)
– Retail industry (Sales by retailers in Great Britain directly to end consumers, including spending on goods (in-store and online)
– Tourism industry (Tourism and travel (including accommodation services, food and beverage services, passenger transport services, vehicle hire, travel agencies and sports, recreational and conference services), employment levels and output of the tourism industry, the number of visitors to the UK and the amount they spend)
- Economy
Insights on UK`s macroeconomic data, GDP, taxes, inflation, etc.
- Employment and labour market
Employment data covering employment rates, hours of work and earnings.
- Population and community
– Births, Deaths and Marriages
– Household Characteristics
– Cultural Identity
– Healthcare
– Education & Childcare
– Population & Migration
– Housing information
– Personal and household finances
– Leisure and tourism
Wellbeing (Statistical bulletins on societal and personal wellbeing metrics, such as life satisfaction, happiness and anxiety on a nationwide and local level)
This is a service provided by the Office for National Statistics that publishes statistics related to population, society and the labour market at national, regional and local levels. You can find data from current and previous censuses, as well as other sources.
For EU
- Eurostat
This is the official website of the European Commission’s statistical office. It provides data and analysis on various topics related to the EU’s economy, society and environment. You can find data tables, microdata, data visualisations, publications and more on this website. Some of the topics covered are GDP, population, inflation, trade, industry, Brexit and more.
International data:
- Organisation for Economic Co-operation and Development – OECD
For economic and different industries information. - The International Trade Center
The International Trade Centre has developed four Market Analysis Tools : Trade Map, Market Access Map, Investment Map and Standards Map to enhance the transparency of global trade and market access and to help users in their market analyses.
Statista.com
You have a free access to key insights information on various industries covering numerous countries around the world that might be enough to extract figures for some of your assumptions or validate your market size calculation with the Market size data they provide- Grandviewresearch
Grandviewresearch publish paid market size, share and trade research reports on different industries you might be interested in (covering the technologies and software markets as well).You can get free information and how much a particular market is worth from the report summary of each research paper. - Mordor Intelligence
Paid research papers, but key market size information and figures across different geos and verticals is available in the report summary. Easy to search and find.
Example
Now, let`s see how things play out in practice. I`ll give you an example with an imaginary case and we`re going to have a look at the process of market sizing step-by-step. For the sake of this demonstration, I`m going to employ the top-down approach, which is my method of preference, especially when we have enough statistical data on the main factors that make up our target market. For those factors we have no direct data on, we can make up assumption, of course based on common sense, logic and оr other known relevant data that can be linked to our assumption in one way or another. The good thing about the top down approach is that it is relatively straightforward and quick way to estimate the potential market size of any product or industry.
The case:
We want to develop a monthly-subscription learning app for kids aged 2-6 and need to justify the project and its resource investment before its executives. For that purpose, we need to evaluate the market for such an app. This should contain market size estimations among everything else. The primary market is the US and hence, we are going to look at US data only. How we go about the market sizing part?
Note: If we were to target more countries, what we had to do is to estimate the respective market size of each target country separately and then sum up what we got for each to get the total market size for our app for the markets of our choice.
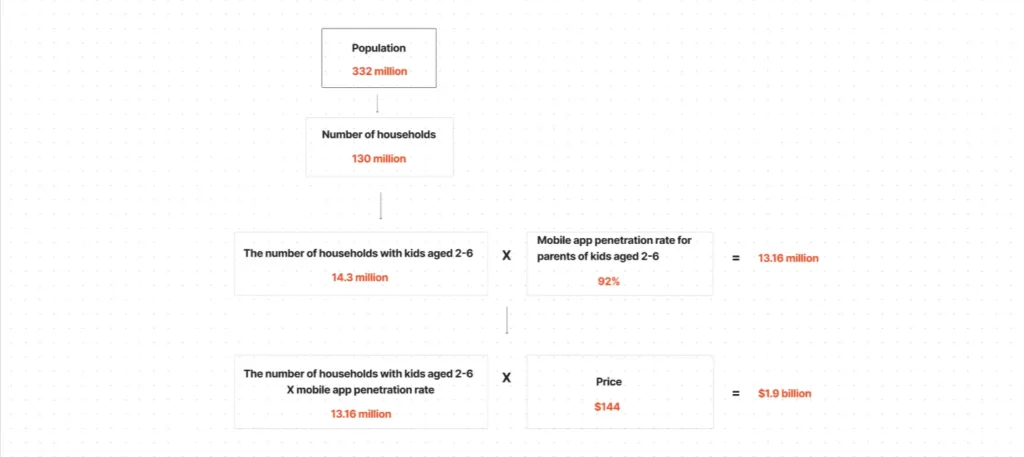
Let`s first see a breakdown of the main factors I would include in my estimation model, along with the formula I would use and an illustration to make it easier to comprehend.
1. Population
When you applying the top-down approach, you normally start with a country`s population, a view from above. Of course, you can skip that part and jump straight to the figures that are relevant to your case, but it`s always better to show your audience what`s the population of a country you are investing in or developing a product for.
So, we`ve got a population of 332 million for the USA.
2. Number of households
The reason why we are drilling down from population to households, rather than the number of people with kids (that is, the number of parents), is that we assume there is one subscription per family instead of both of the parents paying subscription each month, or each kid of the family (if the households has more than one kid in that age range) having a separate subscription plan. Note that this is an assumption, as as such, it can vary and is never 100% accurate. Nevertheless, for the current estimation model, we will take the rule of one subscription plan per family/household as logical and reasonable enough and go from there.
According to the United States Census Bureau, the total number of households in the US is 129,870,928, but in order to not make our calculations over-complicated, we`ll round this number to 130 million households.
3. The number of households with kids aged 2-6
Next, we need to look at a particular subset of the above category. We are not just interested in the number of US households, but in the number of households (families) in the US that have kids aged between 2-6, as this is whom our learning app is intended for.
Here is where you have to bear in mind that the more specific and granular segment you got, the more challenging it will be to find the exact data you need or calculate it accurately (often it will be impossible). This is usually solved by finding data that is as relevant and close to our case, as possible, and making assumptions based on it.
So, the closest data we could find is from Statista, which claims that:
– Approximately 9.23 million family households in the United States in 2022 that had their own children between three and five years of age living in the household.
– Approximately 7,97 million family households in the US in 2022 had their own children under the age of three living in the households.
What I would do with the above two statements is to sum up the two numbers to get the total number of family households in the United States that had their kids under the age of 5 living with them.
9.23 million + 7.97 million = 17.2 million
Now, if we assume that the age distribution of children under 6 is uniform, meaning that there are equal numbers of children aged 0, 1, 2, 3, 4, and 5 in the US (this may not be true in reality, but it is a reasonable approximation for our purpose), we will get the following:
17.2 million / 6 (there are 6 years between 0-5) = 2.86 million household for each age group of 0-5
Since we`re looking at families with kids aged 2-6 and it covers 5 years (we already got the number per year), we will have to multiple fve by the number of the households per year.
2.86 million X 5 years = 14.3 million of households in the US that live with their own kids aged between two-six.
5. Mobile app penetration rate for parents of kids aged 2-6
Since kids of such age range are supposedly going to use a mobile app under the supervision of a parent, we can have a look at the mobile app penetration rate for parents that have kids aged two-six. This is going to be an assumption as well as we couldn`t find any exact data on this factor, nor any variables that would allow us to calculate it ourselves in a way that is accurate enough.
The closest data we got is:
– According to a 2020 survey of parents in the United States, 97% of the respondents with children 8 years and younger had smartphones (or the percentage of mobile device access among children of 8 and younger in households in the United States) —> We can assume that this is similar to the mobile penetration rate for parents with kids in the age group of 2-6. While it is true that this data is for mobile/smartphone reach, rather than mobile app reach, we can still factor it in, since, in order to use an app, it is enough to have a smartphone.
– Another study of 2023 shows the smartphone reach in the US as being 92%. You can choose to use this figure instead of the above one and it`s still going to be plausible and reasonable, since this study covers bigger sample – the entire US population, while the above one incorporates data from a smaller sample of respondents and even though they are more representative and relevant to our target audience (parents of kids aged 8 or younger), the study is more limited in terms of its extend. That is why in our calculations, I`d prefer to use the rate of 92% – that is, the smartphone penetration rate in the US.
6. The average annual price of a kids learning app
Another element we want to factor in our estimation model, is what the average annual pricing of a kids learning app is. We need to calculate the annual price as the market size numbers are most often than not communicated on an yearly basis.
If your SaaS product is not something the market hasn`t seen so far and you know who your competitors are (or similar companies in this field), you can take that data from existing similar products. If not, you need to find out (whether by making a logical assumption or a survey of your target customers), what is their willingness-to-pay for the type of product you are going to be selling. You can find more information on how to prepare, structure and conduct a willingness-to-pay survey, as well as how to analze your findings, in my free guide to a new product development.
Now, if we go back to our example, we can look up other learning apps for kids that are already on the market and how much they are charging monthly on average, after which multiply it by 12 to get the average annual price. It`s clear that this may vary from app to app, but in most cases divergence is not as big, and you can find an approximate pricing point that is common among the other players in the field. Have in mind that many may offer a generous discount if you pre-pay for the whole year, but we will consider the average monthly price X 12 instead, as we can assume the majority of users pay monthly and do not prepay for a whole year subscription as they prefer to have the option to cancel anytime (we can still lower a bit the average monthly price in our calculations in order to compensate for the annual subscription discounts).
So, let`s say the average monthly subscription equals to $12 (with small discount of the real number accounted for). That means the average annual subscription plan will be $144. That`s the number we are going to use in our market size estimation model.
How to calculate the market size (The TAM)
Once we explored all factors that are part of our estimation model for the total market size of our kids app, and we attached values to each, it`s time to do the necessary calculations to come up with its total market size and complete our task. Here we will make a sense of each element we discussed so far and each value we attached.
So, to calculate the market size, or the total addressable market, for our exemplary app, we will use the following formula:
(The number of households with kids aged 2-6 * The mobile app penetration rate) * Price = TAM
Or in other words:
(14.3 million * 92%) * $144 = $1.9 billion
The total market size for our kids learning app equals to $1.9 billion
Here is an illustration of the model:
Want to Explore More on This Topic?
Delve deeper with these curated resources! Discover insightful articles, expert blogs, and top-rated books to enhance your knowledge and skills.
Note: Some links are affiliate links, which means I may earn a small commission if you decide to make a purchase.

“A Guide to Market Size Calculation and Confidence: The Ultimate Cheat Sheet” by Jerry Schall
A Guide to Market Size Calculation and Confidence by Jerry Schall combines proven market size methodologies with an adaptation for new business models, consumer needs, and market nuances to make it an easy-to-follow process that can serve as the cornerstone for any major business decision. Instead of taking market data at face value, leverage Schall’s books for the cues needed to guide critical thought and analysis.
About the Author: